Fast enough to keep up
Type items like a to-do list. Tab to indent, drag to reorder, drag across the timeline to draw a bar. Every action has a shortcut, so the chart changes as quickly as the plan does.
Plan the work.
Let the timeline tell the story.
PennyGantt is a Gantt chart that feels like a document. Type the outline, draw the bars, and your whole team sees it live. No setup, no per-seat pricing, no credit card.
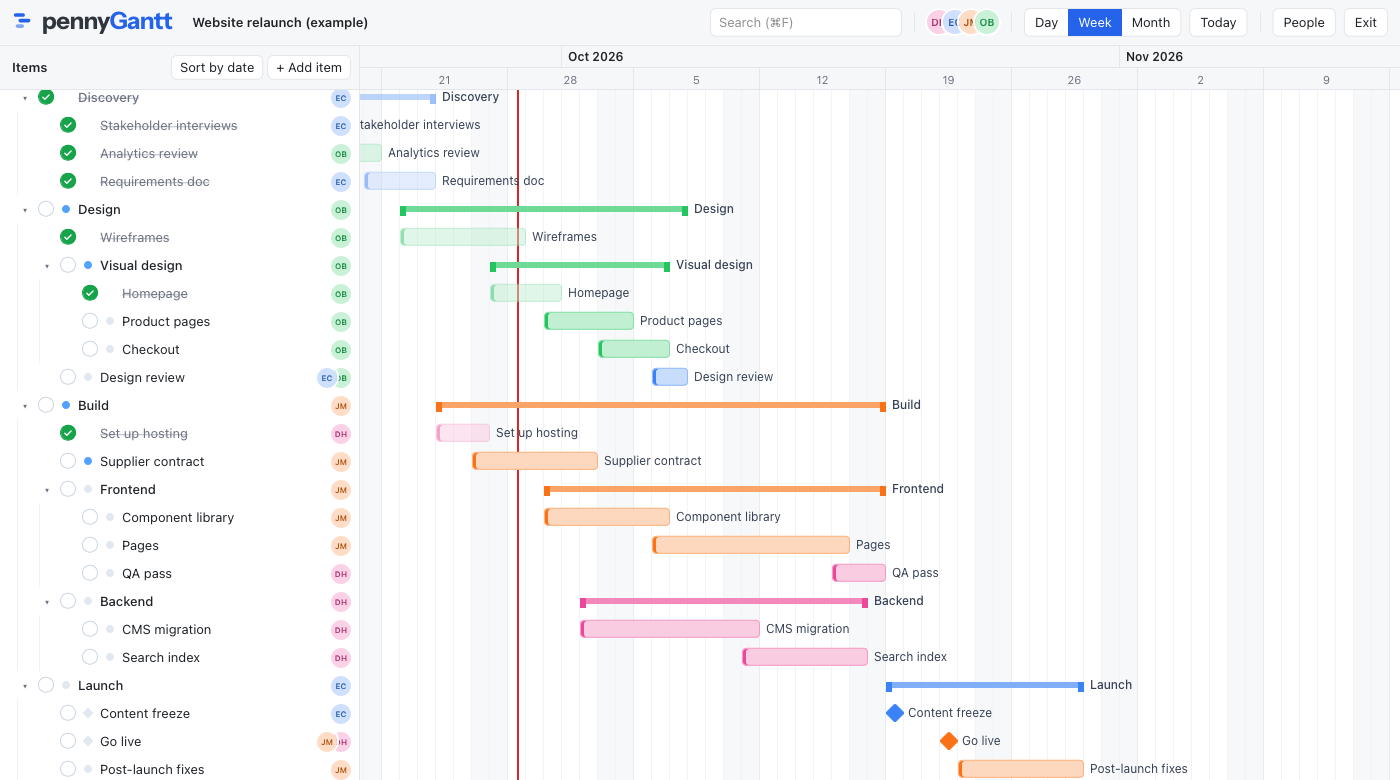
Type items like a to-do list. Tab to indent, drag to reorder, drag across the timeline to draw a bar. Every action has a shortcut, so the chart changes as quickly as the plan does.
One quiet grid, nothing to configure. Late, in progress and upcoming are worked out from the dates, so the chart always tells the truth without anyone updating a status.
No trial that expires, no per-seat pricing, no credit card. Sign in with Google and share your plan with as many people as you need.
Features
Works with Claude
Add PennyGantt as a custom connector in Claude. It reads your projects, creates and moves items, shifts dates and sorts sub-items, acting as you. Describe the plan, then open it and adjust the bars.
Custom connector · MCP
You
Claude
FAQ
Yes. Sign in with Google and start planning. There is no trial, no credit card and no per-seat pricing. Each account can own three projects and be a member of any number of others.
Yes. Share a project with anyone as an editor or a viewer. Every change shows up live for everyone who has it open, and a change log keeps the history.
Yes. Add PennyGantt as a custom connector in Claude and it can read your plans, create and move items, shift dates and search, acting as you.
No. PennyGantt runs in the browser on desktop. Nothing to download or set up.
Plans are stored on Google Cloud in Europe. Deleting your account removes the projects you own and everything in them.